
Displaying Charts or Graphs has always been an important feature for reporting and both windows and web applications reports can be made productive for top management by visualizing data with the help of charts. Since the introduction of ASP.NET first version developers realized that there is no built in Chart control and they have to buy and use third party charting controls for their web applications. Many companies start providing high quality and feature rich commercial charting controls to developers. Finally ASP.NET developers received good news from Microsoft when a FREE ASP.NET Chart control is introduced and made available to developers as a separated download with hundreds of charts samples. In this tutorial I will show you how you can use ASP.NET chart control in your web applications.
Microsoft Chart Control for ASP.NET 3.5 allows you to build all type of charts including Bar, Line, Pie, Column, Area, Point, Range, Circular, Data Distribution, Accumulation and Combination charts. It also supports many great features such as 2D and 3D rendering, feature to combine multiple chart types, support of client side JavaScript and AJAX and so on. Following figure shows the samples of just few of the charts you can build with the help of Microsoft Chart Control. I took these screen shorts from the samples included with the Chart control and you can browse and check more than hundred samples to see all the capabilities of Microsoft Chart Control for ASP.NET.
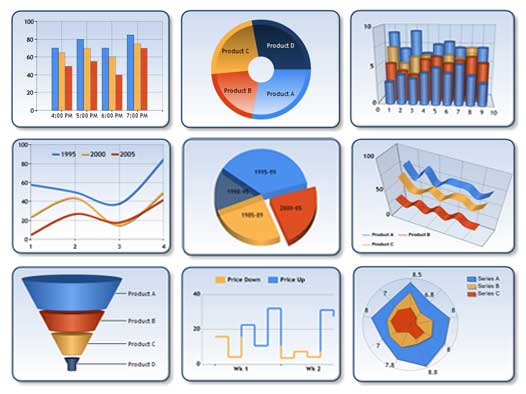
If you are impressed by the above sample charts and wants to use this control in your ASP.NET web application you need to keep following requirements in mind before actually start working with chart control.
Microsoft .NET Framework 3.5 Service Pack 1 is required to use the Microsoft Chart Control for ASP.NET so If your system is still running .NET Framework 3.5 you have to download and install .NET Framework 3.5 Service Pack 1.
Microsoft Chart Control for ASP.NET is not part of .NET Framework 3.5 so you have to download it separately along with the highly recommended chart samples. You can download both of these things from the following links.
Chart Control Assemblies Download Link
Chart Control Samples Download Link
http://code.msdn.microsoft.com/mschart
Once you have installed the chart control on your machine, you are ready to use the Chart control in your application. Keep in mind that when you will install Chart control on your system it will put all the chart control related assemblies in the following location by default.
C:\Program Files\Microsoft Chart Controls\Assemblies
To start this tutorial and to see the chart control in action creates a new ASP.NET website in Visual Studio. To make chart control available in your website, you simply need to add the following chart related .NET assemblies in your website bin directory so simply copy these two assemblies from the above location to your project bin directory.
System.Web.DataVisualization.dllSystem.Web.DataVisualization.Design.dll
If you want to use Microsoft Chart control by simply dragging and dropping on the web page, I will recommend you to add Chart control to the toolbox. For doing this, Right Click in toolbox click Choose Items option and browse and select the System.Web.DataVisualization.dll. You will see the following Chart control icon appearing in your toolbox.
Drag the chart control from the toolbox to the page and you will see the design time appearance of the Chart control as shown in the following figure. In this tutorial I want to show you column and pie chart examples so you can drag two chart controls instances from the toolbox.
For the purpose of this tutorial, I have created a sample database with the following two tables in it. I have also added some sample categories and products in these two tables.
To bind data with Chart control I am writing a simple SQL query with INNER JOIN to count the number of products in each category in the database. The result of the query is available as DataTable object from which I can easily create DataView object by using DefaultView property of DataTable class. The reason I need to create the DataView object is that the Chart control has several data binding related methods which requires DataView object to be passed. You can see one such method DataBindXY used in the code below.
protected void Page_Load(object sender, EventArgs e)
{
   if (!Page.IsPostBack)
   {
      LoadChartData();
   }
}

private void LoadChartData()
{
   string constr = @"Server=TestServer; Database=SampleDatabase; uid=sa; pwd=123;";
   string query = "SELECT c.CategoryID, c.CategoryName, " +
   " Count(p.UnitPrice) AS 'TotalProducts' " +
   " FROM Categories c " +
   " INNER JOIN Products p ON c.CategoryID = p.CategoryID " +
   " GROUP BY c.CategoryID, c.CategoryName";

   SqlDataAdapter da = new SqlDataAdapter(query, constr);
   DataTable table = new DataTable();
   da.Fill(table);

   DataView dv = table.DefaultView;

   Chart1.Series["Series1"].Points.DataBindXY(dv, "CategoryName", dv, "TotalProducts");
   Chart2.Series["Series1"].Points.DataBindXY(dv, "CategoryName", dv, "TotalProducts");
}
The DataBindXY method used in the above code accepts four parameters; the first parameter is the reference of the data source you want to use for displaying values on X axis of the chart. The second parameter is the name of the field you want to display on X axis. The third parameter is the data source you want to use for displaying values on Y axis and the last parameter is the name of the field you want to display on Y axis. In the code for I have data bound both of the chart controls we dragged on the page for this tutorial.
Finally we need to configure some of the properties of the Chart control according to the requirements. You can do this from the properties window or directly in the HTML source view. The Microsoft Chart control supports thousands of properties and one can very easily write a complete book on this single control. To learn and use them quickly I will recommend you to check the chart samples available with the Chart control. Following is the HTML markup of both of the chart controls I used in this tutorial and you are free to play with any of the property.
<asp:Chart ID="Chart1" runat="server" BorderlineColor="Black"
   BorderlineDashStyle="Solid" BackColor="#B6D6EC" BackGradientStyle="TopBottom"
   BackSecondaryColor="White" Height="250px" Width="350px">

   <Titles>
      <asp:Title Name="Title1" Text="Microsoft ASP.NET Chart Control"
         Alignment="TopCenter" Font="Verdana, 12pt, style=Bold">
      </asp:Title>
   </Titles>

   <Series>
      <asp:Series Name="Series1" CustomProperties="DrawingStyle=Cylinder,
         MaxPixelPointWidth=50" ShadowOffset="2" IsValueShownAsLabel="True">
      </asp:Series>
   </Series>

   <ChartAreas>
      <asp:ChartArea Name="ChartArea1" BackGradientStyle="TopBottom"
         BackSecondaryColor="#B6D6EC" BorderDashStyle="Solid" BorderWidth="2">
         <AxisX>
            <MajorGrid Enabled="False" />
         </AxisX>
      </asp:ChartArea>
   </ChartAreas>

</asp:Chart>
<asp:Chart ID="Chart2" runat="server" BorderlineColor="Black"
   BorderlineDashStyle="Solid" BackColor="#B6D6EC" BackGradientStyle="TopBottom"
   BackSecondaryColor="White" Height="250px" Width="350px">

   <Titles>
      <asp:Title Name="Title1" Text="Microsoft ASP.NET Chart Control"
         Alignment="TopCenter" Font="Verdana, 12pt, style=Bold">
      </asp:Title>
   </Titles>

   <Series>
      <asp:Series Name="Series1" CustomProperties="DrawingStyle=Pie,
         PieDrawingStyle=Concave, MaxPixelPointWidth=50" ShadowOffset="2"
         ChartType="Pie" IsValueShownAsLabel="True">
      </asp:Series>
   </Series>

   <ChartAreas>
      <asp:ChartArea Name="ChartArea1" BackGradientStyle="TopBottom"
         BackSecondaryColor="#B6D6EC" BorderDashStyle="Solid" BorderWidth="2">
         <AxisX>
            <MajorGrid Enabled="False" />
         </AxisX>
      </asp:ChartArea>
   </ChartAreas>

</asp:Chart>
If you have implemented everything correctly in this tutorial, you will see the following two charts rendered in your browser window.


i need to select x and y positions for chart controls at run time .. can we do that????
can you provide the dlls for me, as i have .net 4.0 and unable to install the 3.5 SP1 for charting. (in server we have .net 3.5 only.)
Thanks, What u put your website name is fact , yeah its really ezzylearning.
i did my task create a chart from web services using asp.net using this example. its working so good. Thanks ezzylearning
In pie chart we need display label for each color right? how we can do this ?
very good and useful article.
A nice code.I ve column that takes the month in bigint, how do i convert the exact month to the string type in the chart x axis. for instance i ve a month in my database that says 3 which simply means march. how do i bind march to the x axis of the chart instead of 3.
Thank you
I love this.
nice graph
The chat control was displaying in toolbox but it is in disable mode. how to over come this problem?
The assemblies was not in the add reference.
Hi brindha
You need to add assemblies references in your project.
really help full
This is really a great stuff
how to show labels on the pie like 4 for laptops ,4 Desktop,,,
Hey Good Tutorial, Thanks for It.
Really helpful to me – thanks
comment je peux tracer plusieurs courbes dans un meme chart
Woow !
Its simply superb….
Can i use different type of charts here?? (like Curve, Line, Area…)
thank for giving such a nice introduction, with it i complete my assignment
i hope i get more help on this website……getting more helpful things also…………….
Hi
Urgent !!!!
Very easy to create chart from this.thanks
Can u please tell me how to change the bar alternate color in same code
good example for me to create chart…
Thanks!!!^^
Very good, simple and straight forward article, thanks
Hi,
I am getting an error when I try to put two or more charts on the same page…
Error “Enumeration already finished. “
Thanks very much for this article. It was just what I needed to help quickly install and start using these charting controls. Frankly, I’m pretty amazed at the power and flexibility MS has given us here.
Great article
Cheers
i have created a datatable that returns 34 rows and 16 column, when i bind databind by series, then it display only 3 or 4 column, not display all of the column.
please help me in this regards
very good style css format…thanks
Thank you for posting this. I am still a beginner in using ASP.NET and I used your post here as my reference in learning this language. Thank you sir and keep up the good work.
This is the good example for understanding the chart control..This gives the basic idea of the chart control…So this is the best tutorial for the biginners of chart control
Hello Sir,
I just wanted to make people aware that if you do this tutorial, you also need to add a using statement like so:
Using System.Data.SqlClient;
// Or you will get and compile time error for the SqlDataAdapter
Yes, of course this namespace need to be imported on top but for simplicity I dont display using or class declaration statements in the tutorial code.